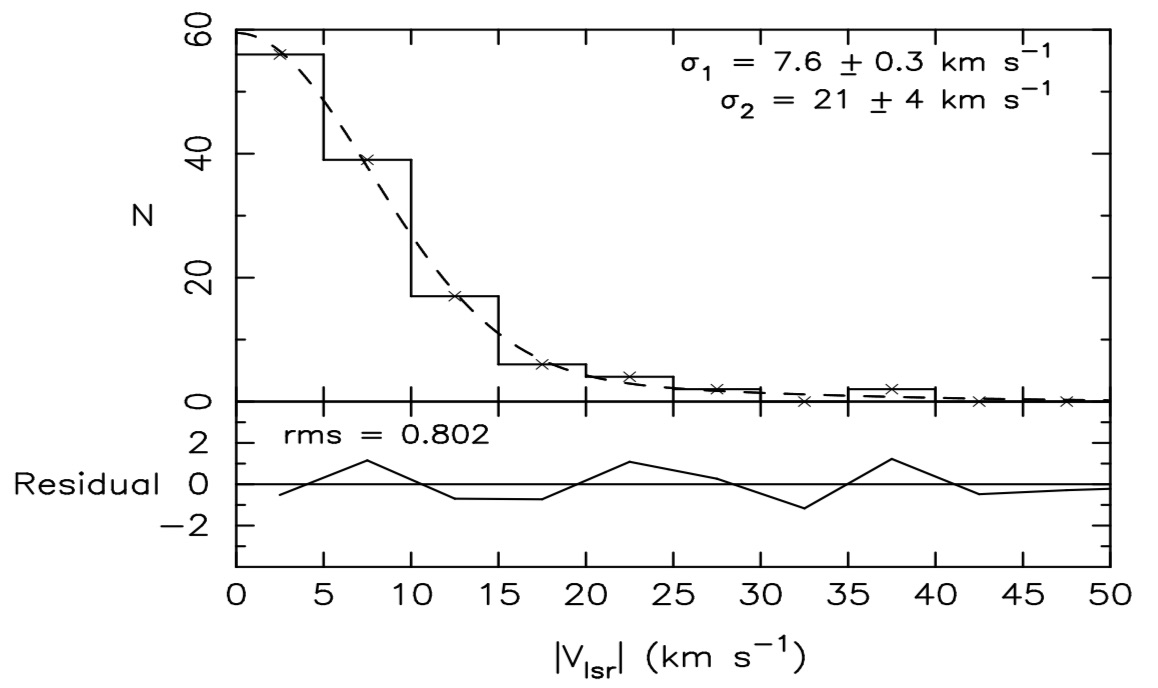
We have carried out a sensitive high-latitude (|b| > 15?) HI 21 cm-line absorption survey towards 102 sources using the GMRT. With a 3sigma detection limit in optical depth of ?0.01, this is the most sensitive HI absorption survey. We detected 126 absorption features most of which also have corresponding HI emission features in the Leiden Dwingeloo Survey of Galactic neutral Hydrogen. The histogram of random velocities of the absorption features is well-fit by two Gaussians centered at Vlsr ?0 km s1 with velocity dispersions of 7.6 ± 0.3 km s-1 and 21±4 km s-1 respectively. About 20% of the HI absorption features form the larger velocity dispersion component. The HI absorption features forming the narrow Gaussian have a mean optical depth of 0.20±0.19, a mean HI column density of (1.46 ± 1.03) × 1020 cm2, and a mean spin temperature of 121 ± 69 K. These HI concentrations can be identified with the standard HI clouds in the cold neutral medium of the Galaxy. The HI absorption features forming the wider Gaussian have a mean optical depth of 0.04±0.02, a mean HI column density of (4.3±3.4)×1019 cm-2, and a mean spin temperature of 125±82 K. The HI column densities of these fast clouds decrease with their increasing random velocities. These fast clouds can be identified with a population of clouds detected so far only in optical absorption and in HI emission lines with a similar velocity dispersion. This population of fast clouds is likely to be in the lower Galactic Halo.
Mohan, Rekhesh; Dwarakanath, K. S.; Srinivasan, G.
2004, Journal of Astrophysics and Astronomy, 25, 185-202
http://cdsads.u-strasbg.fr/abs/2004JApA…25..185M
Notes – taken from the discussion section
The velocity histogram is well-fit by two Gaussians indicating two populations of HI absorbing clouds identified by velocity dispersions ∼ 7 and ∼ 21 km/s respectively (Fig. 9). While the slow clouds were first detected in the optical absorption lines and subsequently in the HI absorption and emission surveys, the fast clouds were only detected in optical absorption lines. The non-detection of the fast clouds remained a puzzle for a long time. The present observations have clarified the nature of the fast clouds to some extent.
There have been attempts in the past to explain the high velocity tail seen in the histogram of random velocities of the optical absorption lines ( Siluk & Silk (1974), Radhakrishnan & Srinivasan (1980), Rajagopal et al (1998)). According to these authors, the high velocity optical absorption lines arise in interstellar clouds, shocked and accelerated by supernova remnants in their late phases of evolution. The fast clouds are therefore warmer and also of lower HI column density as compared to the slow clouds, due to shock heating and evaporation. The present observations indicate that these fast clouds have three times larger velocity dispersion and ten times lower column densities compared to the slow clouds as might be expected if they were from a shocked population of clouds. The decrease in the HI column densities of the fast clouds as a function of their random velocities (Fig. 10) is also consistent with this scenario. The shocked HI clouds are also expected to be warmer than the slow clouds. The mean spin temperature of the fast clouds detected in the GMRT survey is similar to that of the standard slow clouds (Fig. 6). However, this might be a selection effect since for a given optical depth detection limit and an HI column density, clouds with lower spin temperature will be preferentially detected.
The fast clouds with three times higher dispersion are expected to have a scale height about ten times larger compared to the slow HI clouds. Given an effective thickness of 250 pc for the slow clouds, the fast clouds can have an effective thickness of ∼ 2.5 kpc. Therefore, fast clouds can be part of the halo of the Galaxy.